
If you want to understand where the Calgary real estate market is heading, stop listening to opinions and start watching velocity.
Not prices.
Not headlines.
Not social media hot takes.
Speed of sales — how fast homes are actually selling — tells the real story.
Below are two exclusive charts from JerryCharlton.com that track:
Total home sales by month
Average daily home sales by month
Together, they form one of the cleanest signals of market strength, buyer urgency, and negotiating power available in Calgary today.
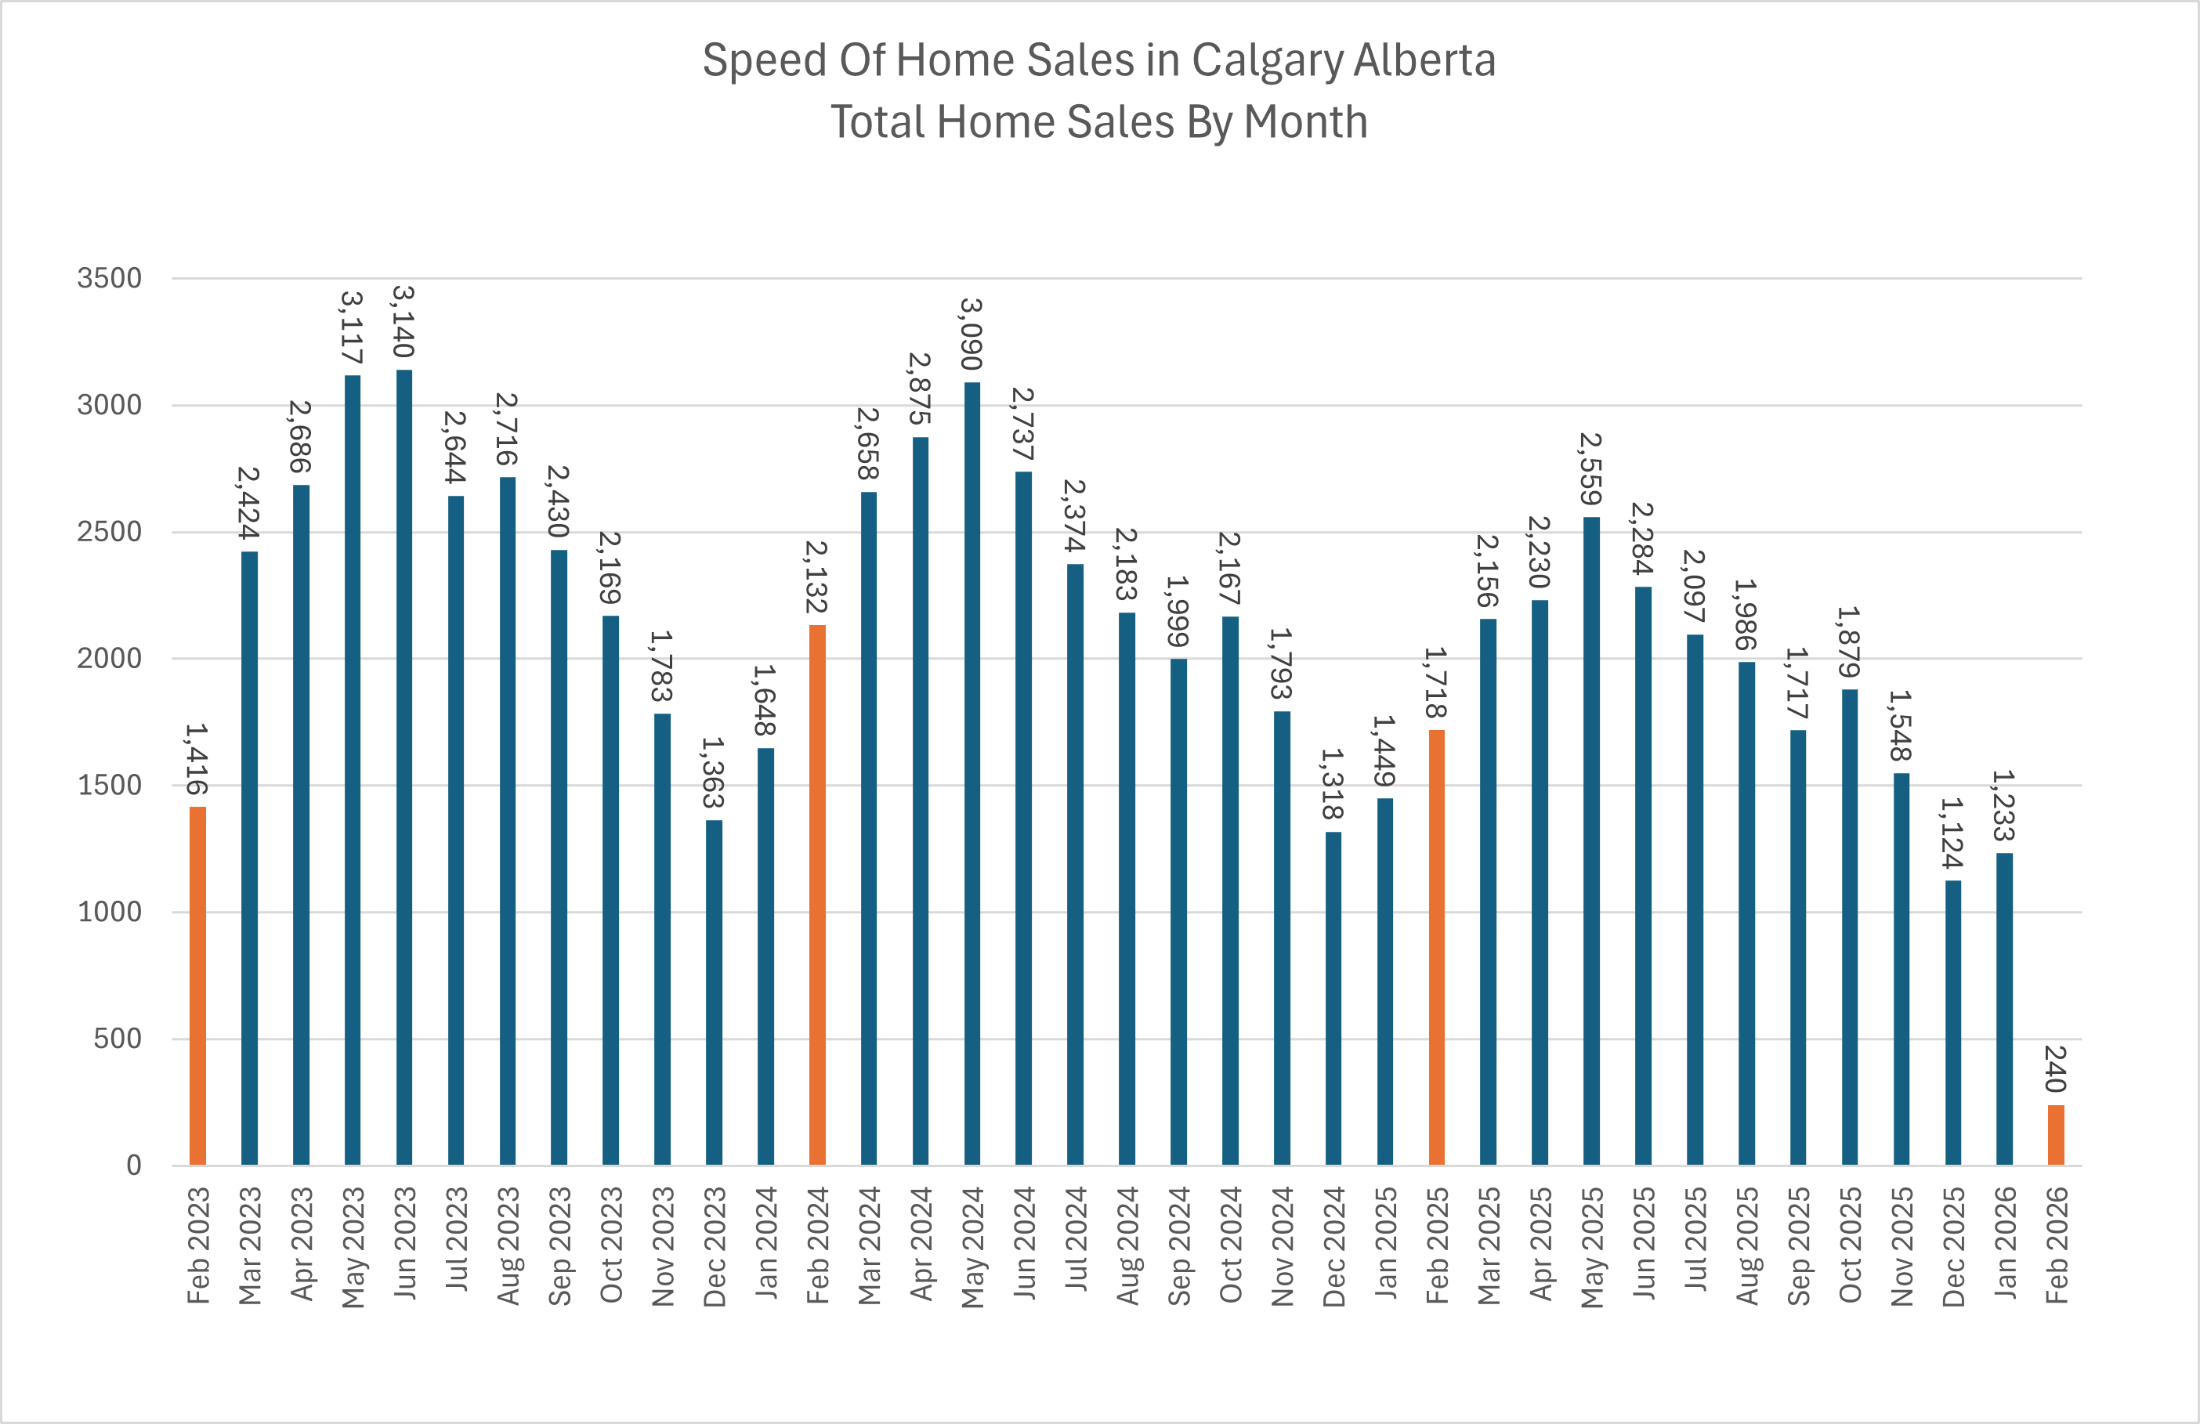
Total Home Sales by Month (Calgary)
Big Picture Pattern
Spring surges every year
Summer cools modestly
Fall slows
Winter hits the brakes
That’s normal seasonality.
But the level of activity inside that cycle is what matters.
Key Observations
Spring 2023 & Spring 2024 peaked above 3,000 sales/month
Spring 2025 peaked closer to 2,550 sales/month
Late 2025 drifted down into the 1,100–1,500 range
Early 2026 is starting around 1,200 sales/month
This is not a crash.
It is a normalization.
Translation:
Calgary moved from red-hot → hot → warm
Still healthy. Still active. Just less frantic.
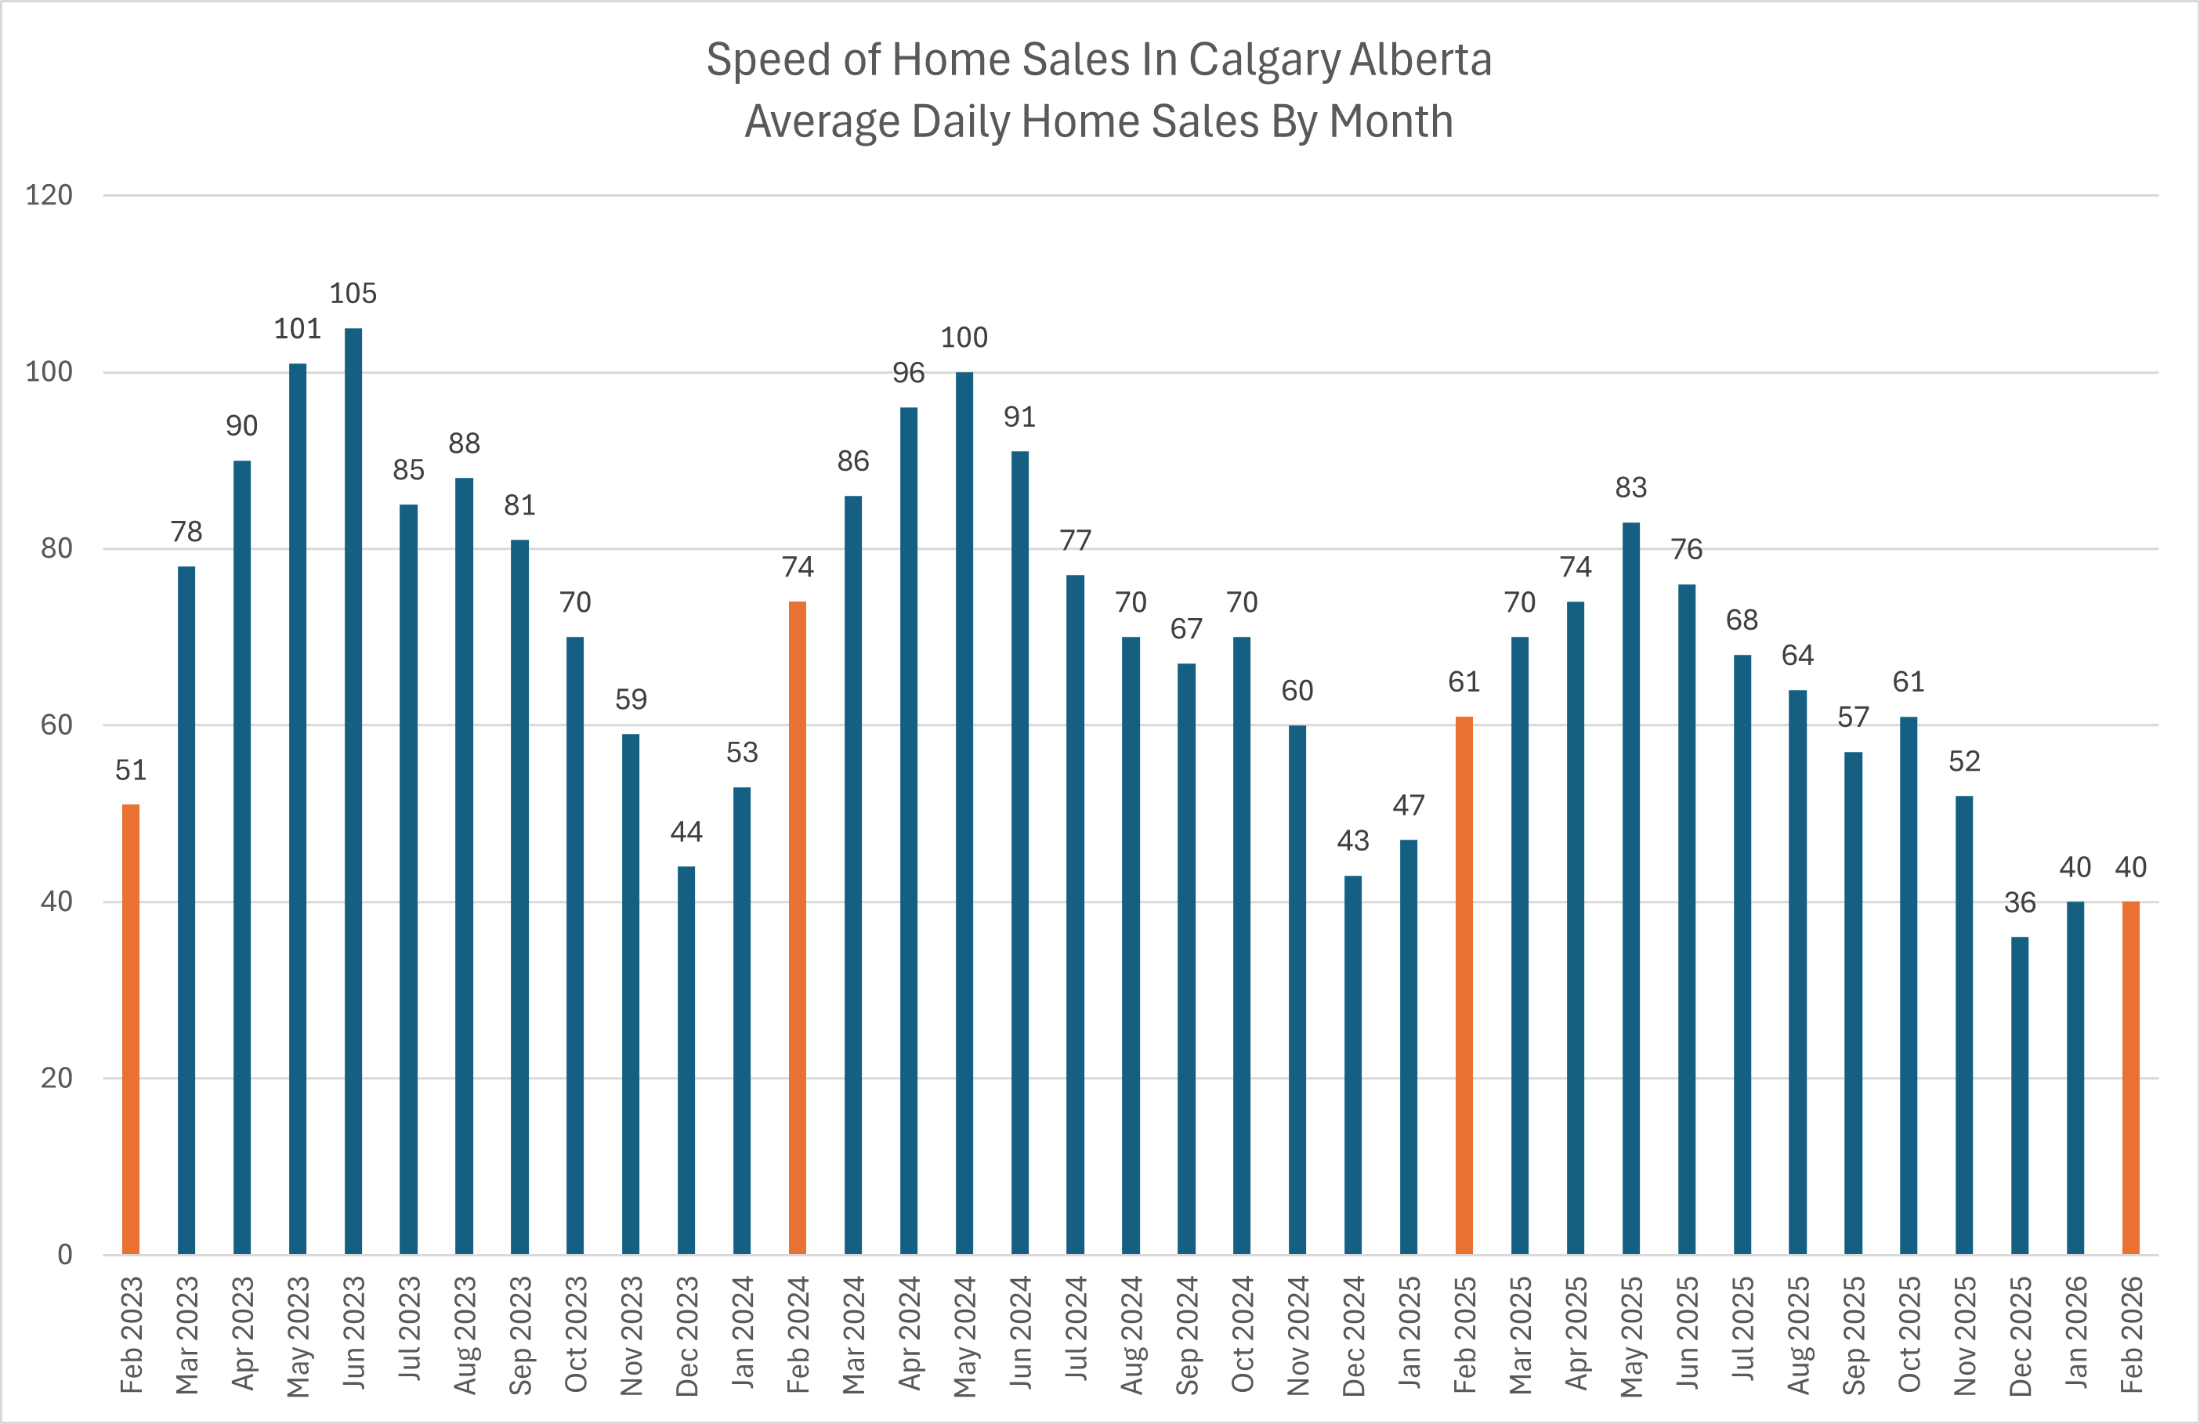
Average Daily Home Sales (Speed of Market)
This chart strips out month length and shows pure velocity.
Peak Speeds
May–June 2023: ~100–105 homes/day
April–May 2024: ~96–100 homes/day
April–May 2025: ~74–83 homes/day
Early 2026: ~40 homes/day
That is a massive deceleration from the frenzy years.
But context matters:
Pre-pandemic Calgary often lived in the 40–60 homes/day range
Today’s numbers are drifting back toward historical norms
This looks less like weakness and more like gravity returning.
What This Means (Plain English)
For Buyers
Fewer bidding wars
More conditional offers accepted
Price sensitivity increasing
Negotiation power slowly returning
You’re no longer shopping in a fire drill.
For Sellers
Pricing correctly matters again
Overpriced listings sit
Presentation, staging, and exposure matter more
This is becoming a skill-based market again.
For Investors
Velocity slowdowns create opportunity
Motivated sellers appear first
Spread between “ask” and “sell” widens
Margin-of-safety buying becomes possible again
This is the early stage where good investors quietly build positions.
Why Speed Beats Price as a Signal
Prices can:
Lag reality
Be sticky on the way down
Be distorted by a few extreme sales
Speed cannot fake.
When sales per day rise → demand is expanding
When sales per day fall → demand is cooling
Velocity turns before headlines do.
That’s why professional traders, hedge funds, and serious real estate investors track rate-of-change before they care about absolute price.
The 2026 Calgary Market in One Sentence
Still healthy. No longer manic. Quietly shifting toward balance.
That’s the environment where smart decisions get made.
Why These Charts Are Different
These charts are built from MLS data and processed into market-speed visuals you won’t find on public portals or media sites.
They focus on:
Micro-trends
Momentum
Direction of demand
Not fluff.
They’re part of a larger analytics system built specifically for Calgary buyers, sellers, and investors who want facts instead of noise.
Bottom Line
If you’re planning to buy, sell, or invest in Calgary over the next 6–18 months:
Watch speed, not hype.
Follow data, not narratives.
Because the people who win in real estate aren’t the loudest.
They’re the best informed.